A Dream Deferred

State of Working Oregon Series
August 4, 2015 Download PDF

A View of Oregon Household Well-Being by Race and Ethnicity

It is obvious today that America has defaulted on this promissory note insofar as her citizens of color are concerned. . . . But we refuse to believe that the bank of justice is bankrupt.
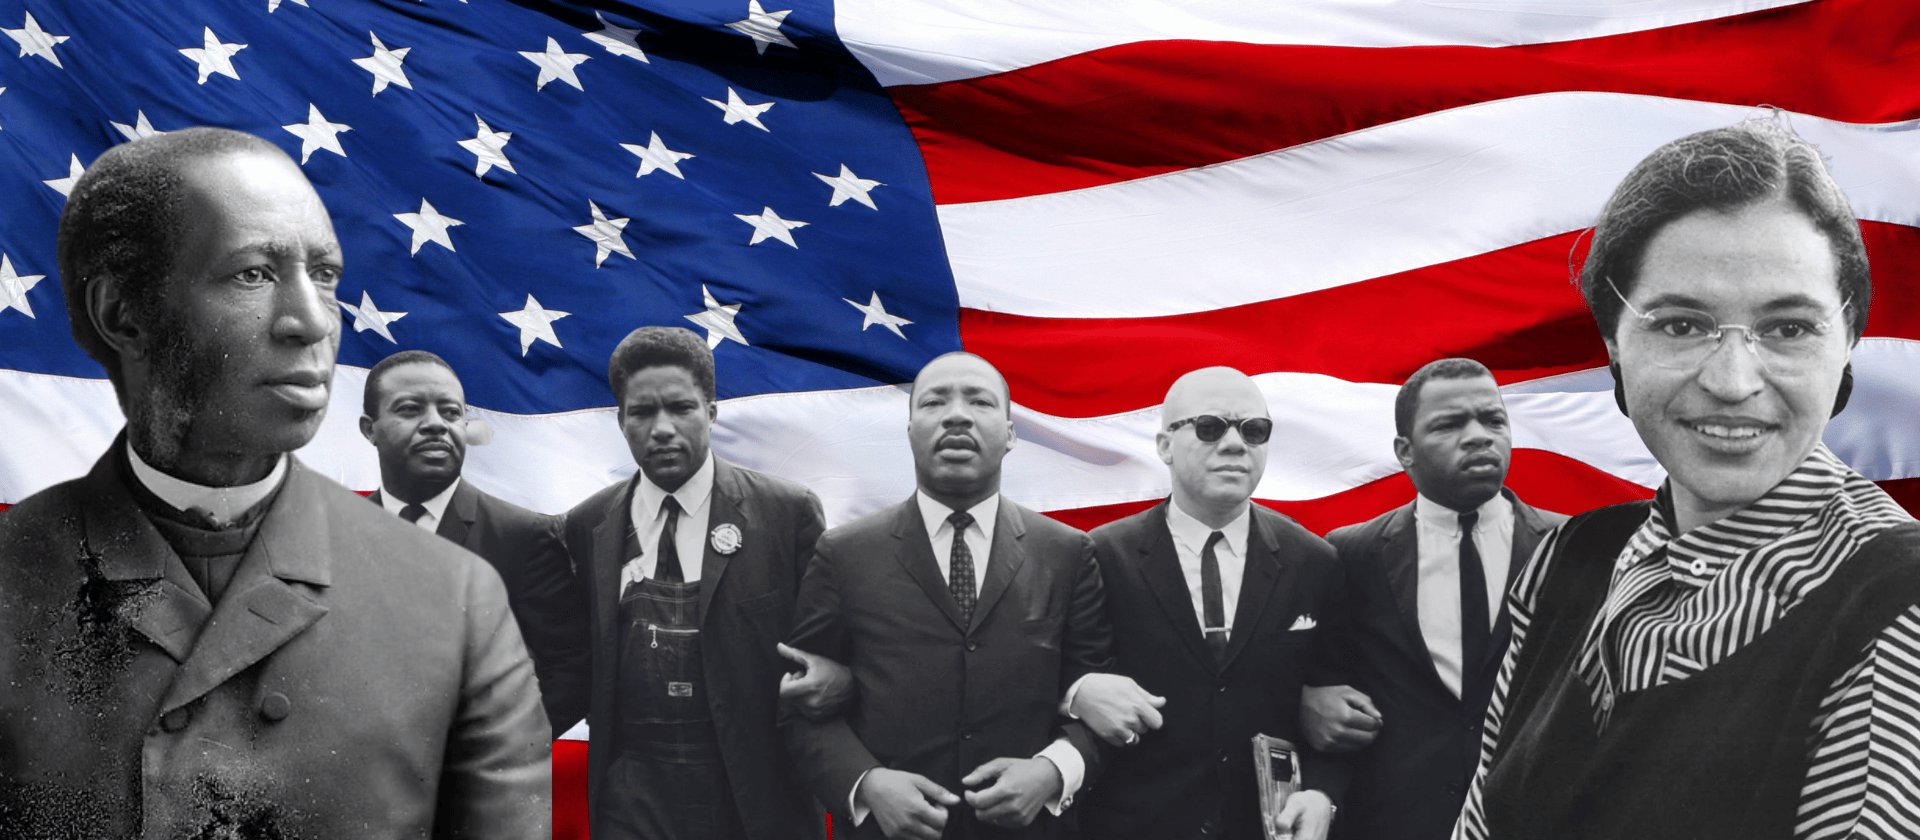
— Dr. Martin Luther King, Jr., August 1963

Dr. Martin Luther King, Jr.’s “I Have a Dream” speech, a stirring call to end racial segregation, was also a plea for economic justice. Dr. King headlined the speakers of the 1963 March on Washington for Jobs and Freedom, an event that sought to bring attention to the lack of economic opportunity faced by millions of Americans, particularly people of color.

Sadly, a little more than a half century after Dr. King’s speech, Oregonians of color generally are still worse off economically than whites by many measures.

Download a copy of this fact sheet:

A Dream Deferred: A View of Oregon Household Well-Being by Race and Ethnicity (PDF)


Related materials:

See the series A View of the State of Working Oregon

In 2013, 16.7 percent of Oregonians lived in poverty. As bad as the poverty rate is for Oregon as a whole, it was worse for Oregonians of color.

In 2013, 15.5 percent of non-Hispanic white Oregonians lived in poverty. By contrast, 27.5 percent of Latinos, 30.6 percent of African-Americans, 31.2 percent of Native Americans, and 31.4 percent of Pacific Islanders lived in poverty. The poverty rate for Asians – 17.6 percent – was not significantly different from the white rate.

Aside from Asians, Oregonians of color were about twice as likely to live in poverty than whites in 2013.


In 2013, the typical (median) Oregon household earned $50,251. The income of the typical household of color, with the exception of Asians, was significantly less than that of the typical white household.[1]

The income of the typical white household was $51,972 in 2013. This exceeded the incomes of the typical Latino, Pacific Islander, African-American and Native American households by about $13,000 or more. To put that in perspective, $13,000 is more than enough to cover a year’s worth of tuition, fees, books and supplies at Oregon State University.[2]

Only Asians had a median income higher than whites.


Work is hardest to find for black Oregonians. In 2014, the unemployment rate for black Oregonians was 13.6 percent, twice the white rate of 6.8 percent.

The unemployment rates for Latinos (9.6 percent) and Asians (4.4 percent) were not significantly different from the rate for whites.

Bureau of Labor Statistics unemployment data does not include rates for Native Americans and Pacific Islanders.


Oregonians of color are less likely to own a home than their white counterparts.

From 2011 to 2013, 62.9 percent of white Oregonians owned a home outright or through a mortgage. By contrast, 58.1 percent of Asians, 47.7 percent of Native Americans, 39.2 percent of Latinos, 33.1 percent of African-Americans, and 23.6 percent of Pacific Islanders owned a home.

Home ownership is a cornerstone of the middle class. Owning a home provides steady shelter and a means of growing family wealth. In 2013, nationally the wealth gaps between white households and African-American and Latino households were some of the widest in 30 years.[3]


The Oregon Legislature Can Take Steps to Address Racial Inequity

Lawmakers can take steps to ensure all Oregonians, regardless of the color of their skin, have an opportunity to get ahead. Some of these include:

Raising the minimum wage. People of color make up a disproportionate share of the minimum wage workforce.[4] A full-time minimum wage worker does not earn enough to meet a family’s basic needs. Minimum wage workers need a substantial raise.

Making it harder for employers to steal wages. Too often employers commit wage theft by forcing workers to work off the clock, stealing tips or not paying their workers at all. Given that wage theft more commonly affects low-income workers,[5] it disproportionately harms Oregonians of color. Lawmakers need to put in place new rules that make it harder for dishonest employers to engage in wage theft and easier for workers to recover stolen wages.

Ensuring all children have health insurance coverage. Children need access to quality health care if they are to grow up healthy and succeed in school and life. In Oregon, about 17,600 children lack health insurance because of their immigration status. Lawmakers should enact the Cover All Kids legislation to ensure all children in Oregon have access to quality care.[6]

Investing more in education. Oregon children sit in some of the nation’s most crowded public school classrooms.[7] And about half of Oregon children arrive to kindergarten without having attended preschool,[8] which helps prepare children to succeed academically.[9] Investing more in education would benefit all Oregon children, especially children of color, who are less likely to be enrolled in preschool.[10]


[1] The American Community Survey, issued by the U.S. Census Bureau, collects data on people’s race and ethnic origin. A person who identifies as white, but is from Cuban, Mexican, Puerto Rican, Central or South American, or another Spanish-speaking culture would be categorized as racially white and of Hispanic or Latino origin. In this fact sheet, “white” refers to “non-Hispanic white” survey respondents. Unless otherwise noted, all calculations in this fact sheet are based on OCPP analysis of American Community Survey data.

[2] For the 2015-16 academic year, tuition and fees for in-state residents at Oregon State University add up to $10,008, books and supplies average $1,950, See “Cost of Attendance,” available here.

[3] The Pew Research Center analyzed data from the Federal Reserve’s Survey of Consumer Finances to calculate the wealth gaps between white and African-American households and white and Latino households. Household wealth is defined as the sum of all household assets minus all debts. Peak wealth gaps were observed in the 1989 survey, but may be the result of anomalies in the data. Aside from 1989, the 2013 wealth gaps between white and African-American households and between white and Latino households were the highest since the Federal Reserve began collecting data. For more see Rakesh Kochhar and Richard Fry, Wealth inequality has widened along racial, ethnic lines since end of Great Recession, Pew Research Center, December 12, 2014, available at http://www.pewresearch.org/fact-tank/2014/12/12/racial-wealth-gaps-great-recession/.

[4] Nationally, people of color are 42 percent of the minimum wage workforce, but just 32 percent of the overall workforce. For more see Realizing The Dream: How the Minimum Wage Impacts Racial Equity in the Restaurant Industry and In America, Restaurant Opportunity Center United, June 19, 2013, available at http://rocunited.org/realizing-the-dream/.

[5] Annette Bernhardt, Ruth Milkman, Nik Theodore et al., Broken Laws, Unprotected Workers: Violations of Employment and Labor Laws in America's Cities, September 2009.

[6] Oregon Center for Public Policy and the Oregon Latino Health Coalition, Health Care for All Children: Oregon Thrives When All Kids Have a Chance to Grow Up Healthy, October 2014, available here.

[7] National Education Association, Rankings and Estimates: Rankings of the States 2014 and Estimates of School Statistics 2015, March 2015, p. 17.

[8] From 2008-2012, 53 percent of Oregon children ages 3 to 5 were enrolled in preschool. Children First for Oregon, County Data Book 2014, October 2014, p. 20, available here.

[9] For a review of the effects of preschool on a child’s development see Steven Barnett, Preschool Education and Its Lasting Effects: Research and Policy Implications, National Institute for Early Education Research, September 2008, available at http://nieer.org/resources/research/PreschoolLastingEffects.pdf. Access to preschool also has positive economic outcomes both for the children enrolled and the broader economy. For more see Robert G. Lynch, Enriching Children, Enriching the Nation: Public Investment in High-Quality Prekindergarten, Economic Policy Institute, May 2007, available here.

[10] From 2008-2012, 48 percent of children of color ages 3 to 5 were enrolled in preschool. Over that same time, 57 percent of white children were enrolled in preschool. Children First for Oregon, County Data Book 2014, October 2014, p. 10, available here.