This report is also available as a PDF: Highest Earning Oregonians Pull Away
Income inequality in Oregon is at an all-time high, by one key measure.[1] The difference between the average income of the richest 1 out of 1,000 Oregonians and the typical Oregonian has never been bigger.[2]
Confronting income inequality is perhaps the greatest challenge facing Oregon today. A growing body of research indicates that income inequality not only limits the ability of working families to get ahead, it also undermines economic growth.[3] Lawmakers must avoid exacerbating income inequality and enact policies that reduce inequality, to ensure all Oregonians have the opportunity to flourish.
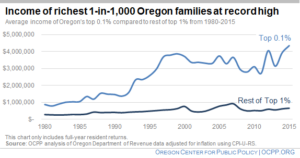
The income of those at the very top of the income ladder — the highest earning 1-in-1,000 Oregonians — is at an all-time high, after adjusting for inflation. To be among the 1,711 households in this group in 2015 (the year with the most recent data), a taxpayer needed to earn at least $1.6 million.[4] The average income of this top group was $4.3 million, the highest on record. While this tiny group has largely fueled the rise of the top 1 percent as a whole, the rest of the top 1 percent saw their average inflation-adjusted income more than double between 1980 and 2015.[5]
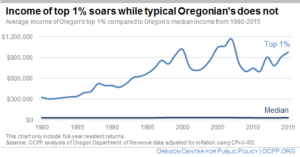
To be among the top 1 percent of earners in Oregon in 2015, a taxpayer had to earn at least $389,400. Their average income was $979,000 that year, nearly triple its inflation-adjusted average income in 1980 of $328,000.
Meanwhile, the income of the typical (median) Oregonian stagnated. The median Oregon income was $34,400 in 2015, just $1,160 higher than in 1980, after adjusting for inflation.
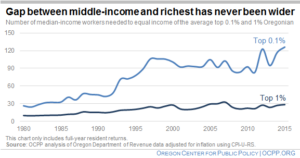
The income gap separating the Oregonian in the middle and those at the very top has never been wider. In 1980, it took 26 typical (median income) Oregonians to equal the average income of the highest-earning 1 in 1,000 taxpayers.[6] By 2015, this had grown to 126 typical Oregonians.[7] That is nearly a five-fold increase.
The top 1 percent — highest-earning 1 in 100 taxpayers — have also seen their earnings rise much faster than the typical Oregonian. In 1980, it took the combined incomes of 10 typical Oregonians to equal the income of the average member of the top 1 percent. The gap rose to 28 median households in 2015, a nearly three-fold increase.
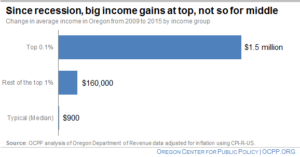
The Great Recession officially ended in 2009. Since then, the average income of the top one-tenth of 1 percent in Oregon increased by about $1.5 million, after adjusting for inflation. It would take the typical Oregonian 45 years to make that much money.
The average member of the top 1 percent as a whole saw their income increase by about $160,000. Over that same time period, the typical Oregonian saw a $900 increase in income.
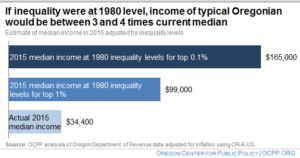
The typical Oregonian would earn far more today if income inequality had remained constant since 1980.
In 1980, the median household income was 10.1 percent of the average income of the top 1 percent in Oregon and 3.8 percent of the average income of the top one-tenth of one percent. By 2015, due to income gains by those at the top, median income shrunk to 3.5 percent of the average income of the top 1 percent and 0.8 percent of the average income of the highest-earning 1 in 1,000 Oregonians.
Had median household income remained at 10.1 percent of the average income of the top 1 percent, the typical Oregonian would have earned over $99,000 in 2015. If the median income had maintained the 3.8 percent share of the average income of the highest-earning 1 in 1,000 Oregonians, median household income in Oregon would be almost $165,000 in 2015.
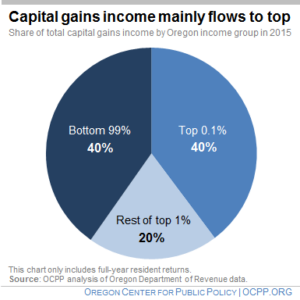
A big driver of income inequality is income from capital gains, which are concentrated at the top. Capital gains income results from the profitable sale of assets such as stocks, bonds, and real estate.
The richest one-tenth of 1 percent of Oregonians captured 40 percent of all capital gains income in 2015 — as much as the entire bottom 99 percent collected.[8] The rest of the top 1 percent received about 20 percent of all capital gains income that year, meaning that the entire top 1 percent reaped about 60 percent of all income from capital gains.
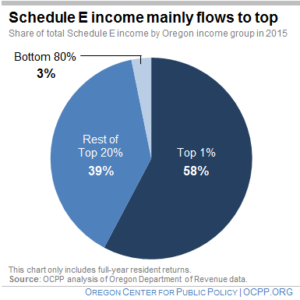
Another type of income concentrated at the top is the income reported on federal tax form Schedule E. It includes income from rental properties, royalties, partnerships, S corporations, estates, trusts, and residual interests in real estate mortgage investment conduits.
Of all income Oregonians reported on Schedule E in 2015, 58 percent went to the richest 1 percent.[9] The rest of the top 20 percent of Oregonians collected 39 percent. Oregon’s lowest earning 80 percent of taxpayers received only 3 percent of all Schedule E income.
Oregon taxes some forms of Schedule E income at a lower rate than income from wages, thereby exacerbating income inequality.
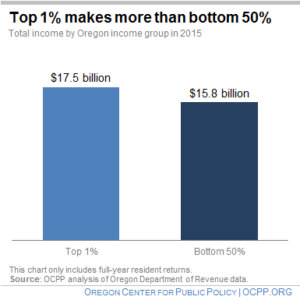
In 2015, Oregon’s highest earning 1 percent took in more income than the entire bottom half of Oregonians.[10]
That year, the top 1 percent together had income of $17.5 billion. The lowest-earning 50 percent of Oregonians, together, earned $15.8 billion.
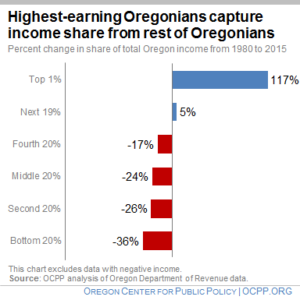
Oregon’s top 1 percent has seen their share of total state income more than double over recent decades, increasing by 117 percent from 1980 to 2015.
The bottom 80 percent of Oregonians saw declines in their share of total income over that same time.[11] The further down the income ladder, the more severe the decline in income share.
In addition to the top 1 percent, the next 19 percent was the only other group to see an increase in its share of Oregon income, a 5 percent increase from 1980 to 2015.
Conclusion
The highest earning 1-in-1,000 Oregonians are hauling in record amounts of income, at a time when the typical Oregonian’s income has stagnated and many are struggling to afford the rising costs of housing, child care, and other essentials. As the latest data underscores, income inequality remains “the defining challenge of our time.”[12]
[1] In this publication “all-time” refers to the time period where data is available for analysis. This covers the tax years from 1980-2015.
[2] This fact sheet uses the terms “Oregonians” and “taxpayers” interchangeably. Unless otherwise noted, these refer to all Oregon income tax filers. In some instances, Oregon Department of Revenue data is only available for full-year resident income tax filers. In those instances, we note that the data is for full-year filers in the chart’s footer with an endnote.
[3] Berg, Andrew G. and Jonathan D. Ostry, “ Equality and Efficiency,” Finance & Development, Vol. 48, No. 3, September 2011,; Ostry, Jonathan D., Andrew Berg and Charalambos G. Tsangarides, Redistribution, Inequality, and Growth, International Monetary Fund, February 2014,; Boushey, Heather and Carter C. Price, How Are Economic Inequality and Growth Connected? A Review of Recent Research, Washington Center for Equitable Growth, October 2014; Ryder, Guy, Urgent Action Needed to Break Out of Slow Growth Trap, International Monetary and Financial Committee, International Monetary Fund, Thirty-Third Meeting, April 16, 2016; Dabla-Norris, Era, Kalpana Kochhar, Nujin Suphaphiphat, Frantisek Ricka, Evridiki Tsount, Causes and Consequences of Income Inequality: A Global Perspective, June 2015; “Trends in Income Inequality and its Impacts on Economic Growth,” OECD Social, Employment and Migration Working Papers, No. 163, OECD Publishing, 2014; Orrson, James, Income Inequality in America: A Call for Action and Effective Policy, White Paper, May 2015.
[4] Calculations for top one-tenth of 1 percent and the rest of the top 1 percent are based on total income for full-year returns because of limitations in data availability of other types of returns.
[5] The inflation-adjusted average income of the rest of the top 1 percent was $284,064 in 1980 and $659,554 in 2015.
[6] Data in this section includes only full-year returns because of limitations in data availability.
[7] This is similar to the more common comparison of worker to CEO pay, as in how many employees does it take to equal the pay of the CEO. See Mishel, Lawrence and Schieder, Jessica, Pay Remains High Relative to the Pay of Typical Workers and High-Wage Earners, Economic Policy Institute, July 2017.
[8] Data in this section includes only full-year returns because of limitations in data availability.
[9] Data in this section includes only full-year returns because of limitations in data availability.
[10] Data in this section includes only full-year returns because of limitations in data availability.
[11] Tax returns with negative adjusted gross income have been excluded.
[12]President Barack Obama, “Remarks by the President on Economic Mobility,” December 4, 2013.