
Executive summary
Oregon teachers deserve a raise. Teachers play an essential role in helping children achieve their potential and contribute to our communities. Unfortunately, Oregon significantly underpays its teachers relative to comparable workers in the private sector.
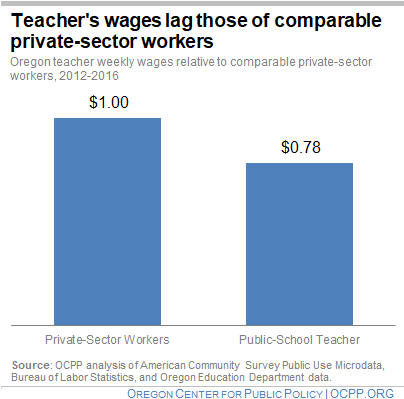
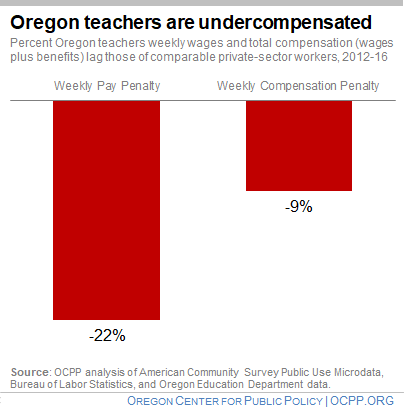
- Public-school teachers in Oregon earn 22 percent less than workers in the private sector with similar levels of education and experience. This analysis evaluates weekly wages instead of annual wages to take into account that teachers work fewer weeks in a year.
- After factoring in the cost to a school district of Oregon’s Public Employee Retirement System (PERS) benefits, health insurance, and other costs, the teacher pay gap narrows by about 13 percentage points. Thus, taking benefits into account, teachers in Oregon earn 9 percent less in weekly compensation than comparable private-sector workers.
- This analysis overstates how much the inclusion of benefits narrows the teacher pay gap, particularly for new teachers. The benefits data employed is for the full cost of benefits, which includes ongoing costs for retired teachers.
- Considering the evidence that female-dominated professions are often devalued and paid less, the fact that Oregon public school teachers are predominantly women may explain part of the teacher pay gap.
By investing more resources to close the teacher compensation gap, Oregon will be better able to retain and recruit high-quality teachers — ultimately helping to improve the educational outcomes of Oregon’s children.
Introduction
Oregon teachers deserve a raise. Teachers play an essential role in helping children achieve their potential and contribute to our communities. Unfortunately, Oregon significantly underpays its teachers relative to comparable workers in the private sector. The gap remains significant even when factoring in retirement and health benefits. To some extent, this pay gap is the product of historic gender discrimination affecting the pay of jobs seen as “women’s work.” Raising teacher salaries would help recruit and retain even more excellent teachers, thereby strengthening education in Oregon.
Recruiting and retaining high-quality teachers is key to student success
Outside of a child’s family and home environment, a teacher has the biggest impact on a child’s ability to learn and thrive.[1] Studies have found that when it comes to learning, a teacher has a larger impact than other in-school factors.[2] High-quality teachers increase academic achievement by providing an enriching, engaging, and positive environment for students to learn.[3] Students with stronger academic achievement tend to have higher earnings over their lifetimes — a benefit for them and the overall economy.[4]
Wages and benefits matter when it comes to recruiting and retaining quality teachers.[5] Like anyone considering their employment options, prospective teachers assess the wages and benefits in determining whether they go into and stay in the teaching field and where they work. States that pay teachers the least have greater teacher shortages and higher teacher turnover.[6]
Oregon is not immune to teacher shortages and high turnover. A 2016 study by the Oregon Department of Education found that while Oregon as a whole is not in a state of crisis, “there are acute shortages” of qualified teachers within subject areas and geographic regions.[7] Further, class size is another key determinant of student success, and Oregon has some of the nation’s most crowded classrooms.[8] To reduce class sizes, Oregon will need to recruit and retain more qualified teachers.
Oregon teachers are underpaid
Teachers in Oregon are underpaid relative to comparable private-sector workers.[9]
The findings in this report are based on a regression analysis estimating the difference in weekly wages earned by public school teachers and comparable private-sector workers. The paper examined data from the Bureau of Labor Statistics, Oregon Department of Education, and the American Community Survey for years ranging between 2012 and 2016. The report controls for key determinants of wages, such as education and age, to ensure the analysis compares workers with similar experiences and demographics. (For a detailed description of the methodology used in this report, please see the Appendix.)
Such analysis finds that public-school teachers in Oregon earn 22 percent less than workers in the private sector with similar levels of education and experience.[10] Put another way, an Oregon teacher makes only 78 cents for every dollar earned by a comparable private-sector worker in Oregon.
This analysis evaluates weekly wages instead of annual wages to take into account that teachers work fewer weeks in a year. By looking at weekly wages instead of annual wages the fewer weeks worked doesn’t distort our comparison between public school teachers and private sector workers. For example, a teacher working 42 weeks per year making $50,000 would have weekly wages of $1,190. A private-sector worker who works 50 weeks in a year and made the same amount would have weekly wages of $1,000. In this way, the use of weekly wages accounts for the so-called “summers off.” It is important to note that many teachers do work during the summer, completing professional development, creating and refining curriculum, and conducting other activities related to helping their students succeed, potentially understating the pay gap.[11]
These findings are consistent with analysis at the national level. In fact, the gap between what teachers and comparable private-sector workers earn has been growing over time at the national level. In 1996, average weekly wages of teachers at the national level were 4 percent less than similarly situated workers. By 2015, the national gap had risen to 19 percent.[12]
Even with benefits, Oregon’s teachers are undercompensated
Even after accounting for the benefits earned on the job, the compensation of Oregon teachers still lags that of similar workers in the private sector. Public-sector workers such as teachers tend to enjoy more generous benefits than comparable private-sector workers. After factoring in the cost to a school district of Oregon’s Public Employee Retirement System (PERS) benefits, health insurance, and other costs, the teacher pay gap narrows by about 13 percentage points.[13] Thus, taking benefits into account, teachers in Oregon earn 9 percent less in weekly compensation than comparable workers.[14] Stated differently, even with the benefits that teachers receive, they still earn only 91 cents for every dollar in compensation earned by a comparable private-sector worker in Oregon.[15]
This analysis overstates how much the inclusion of benefits narrows the teacher pay gap, particularly for new teachers. The benefits data employed is for the full cost of benefits, largely retirement and health insurance, to the school districts and to private-sector employers. For school districts, this includes ongoing costs for retired teachers, who generally have more robust benefits than new teachers will receive. This analysis allocates to current teachers the cost of PERS and all other benefits for both past and current teachers, to produce an average per-teacher cost to the school district. As a consequence, the actual value of retirement and other benefits for current and all new teachers is less than the average per teacher cost of benefits figure employed in this analysis.[16]
Efforts to cut PERS could exacerbate the teacher compensation gap. The Oregon Supreme Court has ruled that PERS is a contract between the employer (school district) and employee (teacher). As such, the employer cannot unilaterally reduce benefits that the employee has already earned. Changes to PERS cannot be made retroactively; they can only be made on a going forward basis.[17] Thus, the few options left available to lower PERS costs are to cut benefits for current and future teachers. Doing this would widen the compensation gap between current teachers and comparable private-sector workers.
Gender discrimination helps explain the teacher pay gap
Research has found a substantial wage gap between men and women.[18] One of the drivers of the gender pay gap is that occupations dominated by women tend to pay less, even after accounting for education and skill levels. There is evidence that when women move into certain lines of work, such as teaching, those jobs begin to pay less for men and women alike.[19]
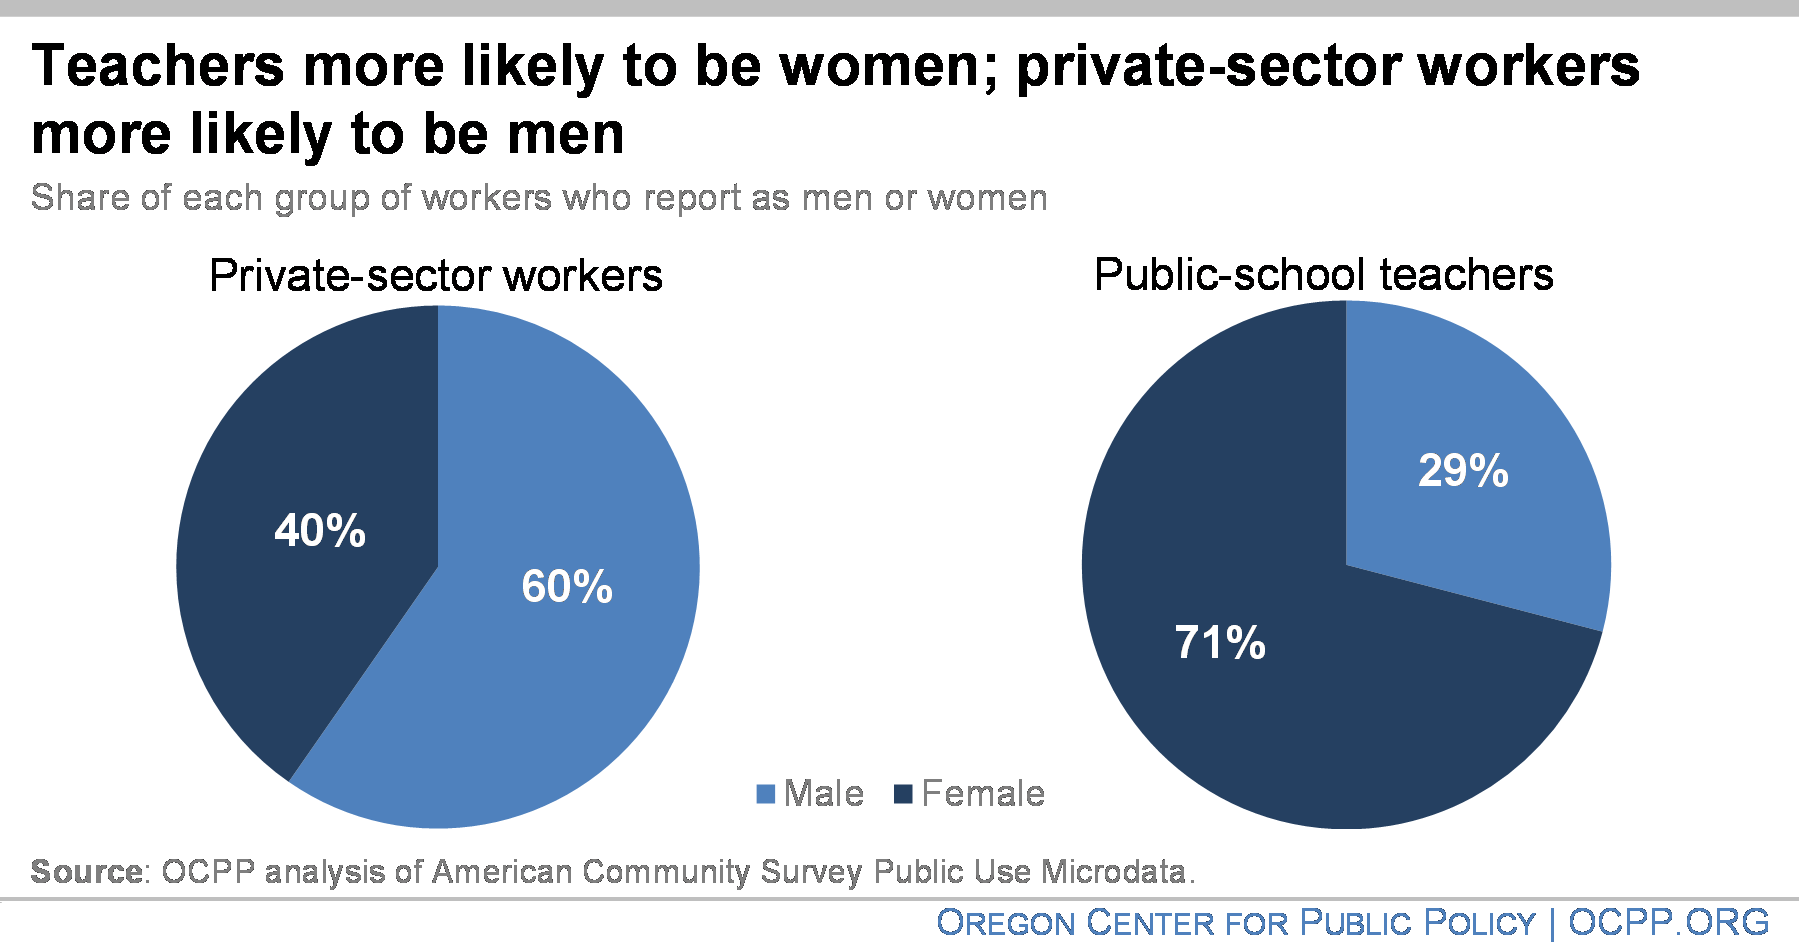
Teachers in Oregon are more likely to be women than private-sector workers are. In Oregon, seven out of 10 public-school teachers are women. By contrast, four out of 10 private sector workers are women.[20] Considering the evidence that female-dominated professions are often devalued and paid less, the fact that Oregon public school teachers are predominantly women may explain part of the teacher pay gap.
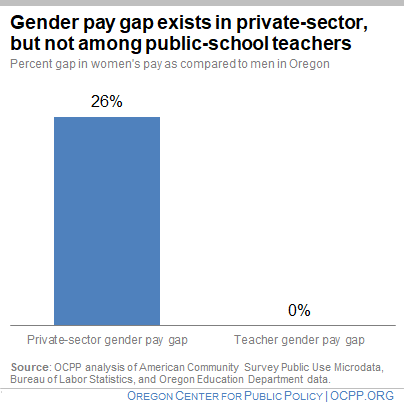
Within the public teaching profession itself, the data did not show a gender pay gap. Oregon’s female and male public-school teachers appear to earn the same, controlling for the influence of age, education, and other factors. By contrast, this analysis shows a significant gender pay gap among full-time private-sector employees in Oregon, with women receiving weekly total compensation 26 percent lower than men. The apparent lack of a gender pay gap among public school teachers is likely due to the presence of collective bargaining agreements that set transparent and uniform compensation packages.
That’s not to say that gender discrimination has disappeared within public schools. While teachers are substantially more likely to be women in Oregon, school principals are about as likely to be men as women, and district superintendents are more likely to be men.[21] This reflects a trend across the rest of the economy, where men are promoted and identified for leadership at higher rates — an indication of structural discrimination.[22]
Conclusion: Oregon teachers deserve a raise
Few professions are more vital to the well-being of children and communities than teachers. Teachers are central to helping children succeed academically and thrive later in life.
Yet, Oregon undervalues the contribution of public school teachers, as reflected by the significant pay gap that exists between teachers and comparable private sector workers. By investing more resources to close the teacher compensation gap, Oregon will be better able to retain and recruit high-quality teachers — ultimately helping improve the educational outcomes of Oregon’s children.
Appendix: Methodology
This paper analyzed the wages and total compensation (wages plus benefits) of teachers and comparable private sector workers as follows:
Data and analysis of wages
This analysis used the U.S. Census American Community Survey (ACS) Public Use Microdata Sample (PUMS) from 2012 to 2016, the newest data available. While other analyses have used data from the Current Population Survey (CPS), there is an inadequate Oregon-specific sample size available in that dataset. The ACS PUMS data includes information on annual wages, occupation, age, and dozens of other variables for each of the more than 190,000 Oregon respondents to the survey.
The data was filtered similarly to the work of Alegretto and Mishel, and Keefe.[23] This analysis included only working-age adults (between the ages of 18 and 64) who worked full-time (35 hours or more per week), were employed most of the year (40 weeks or more), and reported positive income. In some cases, the Census imputes an income based on other variables, which can result in a systemic bias to the data. Thus, this analysis removed individuals with imputed wages.
Only special education, elementary, middle, and secondary teachers who worked in the public sector were considered public-school teachers. The analysis did not include kindergarten and early childhood education teachers. This analysis would include kindergarten teachers if the data didn’t group kindergarten and early childhood education teachers together, so they cannot be separated. Early childhood education teachers are not included in the K-12 education system and have significantly different compensation structures which would have biased the results. These filters were applied to leave the sample with more than 41,000 Census observations, representing nearly 850,000 Oregonians.
This analysis estimated weekly wages by dividing the annual wage data by the number of weeks worked. The ACS only includes bins of weeks worked, rather than the exact amounts, but prior analyses by Keefe found the use of the midpoint of these bins produces results nearly identical to more complex prediction methods. Weekly pay and weekly total compensation were then converted to logarithms so that the regression model would generate estimates of the impacts of changes in the values of variables in terms of percentage points.
A log-linear regression was run with weekly wages and weekly total compensation as the dependent variables. The independent variables included age (as a proxy for experience), education, race, ethnicity, gender, marital status, and citizenship status of the individual. The other key binary variable indicated if the individual was a public-school teacher or not. By including all of these explanatory variables, this analysis controlled for variations in workers that could conceivably affect their compensation. Standard specification tests for homoscedasticity, multicollinearity, normality of residuals, and outliers were conducted and did not find clear issues with the model.
Benefits
The data on teacher benefits came from the Oregon Department of Education (ODE). The data used in this analysis covered the 2011-2012 to 2015-2016 school years, to best match the PUMS wage data. This data only included public school teachers in Oregon. The ODE data and this analysis added the 6 percent employee contribution to PERS paid for by the district, where applicable, in the salary figure. Benefits included employer costs of retirement, health insurance, long-term disability insurance, tuition reimbursements, retiree health care, and early retirement incentives for districts with declining enrollment. Some school districts have used Pension Obligation Bonds (POB), which are voter-approved bonds that pre-pay pension liabilities but have servicing costs over time. The estimate of benefits includes POB servicing costs, where applicable. The POB costs reduced the benefits of POBs in reducing PERS rates by about 75 percent. The ratio between salary and benefits was calculated and then applied to every public-school teacher in the ACS data, mirroring the benefit estimation method of Keefe.[24]
To ensure a comparable analysis between private-sector employees and public-school teachers, this analysis used data from the Bureau of Labor Statistics Employer Cost of Employee Compensation survey to estimate compensation for private sector workers. This data included a breakdown of all compensation by salary, paid leave, insurance, retirement, and more. The detailed benefits and salary data allows this analysis to assign a similar ratio between salary and benefits to private-sector workers as was done for public-school teachers. To ensure consistency between datasets, the private-sector benefit data was averaged over the 2011-2016 years. Because the benefits data is unavailable for full-time workers in Oregon, this analysis used unpublished data on full-time workers in the Pacific region provided by the Bureau of Labor Statistics.
Endnotes
[1] Erik A. Hanushek, and Steven G. Rivkin, “Teacher Quality,” in E. A. Hanushek and F. Welch, eds., Handbook of the Economics of Education, pp. 1051-78, 2006.
[2] Teachers Matter: Attracting, Developing and Retaining Effective Teachers, Organisation for Economic Co-operation and Development, 2005; Teachers Matter: Understanding Teachers’ Impact on Student Achievement, RAND Corporation, 2012.
[3] Jonah E. Rockoff, “The Impact of Individual Teachers on Student Achievement: Evidence from Panel Data,” The American Economic Review, vol. 94, no. 2, 2004.
[4] Jennifer Ma, Matea Pender, and Meredith Welch, Education Pays 2016, College Board; Noah Berger and Peter Fisher, A Well-Educated Workforce Is Key to State Prosperity, Economic Policy Institute, 2013; Robert Barro, Economic Growth in a Cross Section of Countries, 1989.
[5] Linda Darling-Hammond, Roberta Furger, Patrick M. Shields, and Leib Sutcher, Addressing California’s Emerging Teacher Shortage: An Analysis of Sources and Solutions, Learning Policy Institute, 2016; Matthew D. Hendricks, “Does it pay to pay teachers more? Evidence from Texas,” Journal of Public Economics, vol. 109, 2014.
[6] Nicole Katz, Kate Weight Apfelbaum, Stephen Frank, and Karen Hawley Miles, Low Teacher Salaries 101, Education Research Strategies, June 2018.
[7]Kelly Lovett, Understanding and Identifying Teacher Shortage Areas in Oregon, Oregon Department of Education, 2016.
[8] Oregon has the 6th largest class sizes as measured by the average students for each teacher controlled for the average daily attendance. Data available from the National Education Association. William Mathis, The Effectiveness of Class Size Reduction, National Education Policy Center, June 2016.
[9] This analysis is similar to analyses of other states teacher wage and total compensation gaps. Jeffrey Keefe, Pennsylvania’s teachers are undercompensated–and new pension legislation will cut their compensation even more, Economic Policy Institute, February 2018; Jeffrey Keefe, New Jersey public school teachers are underpaid, not overpaid, Economic Policy Institute, February 2017; Sylvia Allegretto and Lawrence Mishel, The teacher pay penalty has hit a new high, Economic Policy Institute, September 2018.
[10] The wage and compensation analyses in this paper control for age (as a proxy for experience), education, race, ethnicity, gender, marital status, and citizenship of the individual – all factors known to impact an employee’s earnings. Race, ethnicity, and gender disparities are indicative of structural racism and discrimination, not any difference in actual productivity or value to the employer. See the appendix for more information on the methodology used.
[11] Gina Belli, Do Teachers Really Get Summers Off? Payscale, 2015. Teachers who work over the summer are hard-pressed to match their weekly wages earned as a teacher. Since they have professional development, years of experience, and specialized education dedicated to being a productive and effective teacher, their compensation is modestly higher. Entering a detached field, such as waiting tables or driving Uber, does not provide financial benefits to that education or experience. Further, part-time work has lower hourly pay than full-time work as shown in David M. Pongrace and Alan P. Zilberman, A Comparison of Hourly Wage Rates for Full- and Part-Time Workers by Occupation, Bureau of Labor Statistics, 2009.
[12] Sylvia Allegretto and Lawrence Mishel, The teacher pay penalty has hit a new high, Economic Policy Institute, September 2018.
[13] Benefits for Oregon public-school teachers in this analysis include employer costs of retirement, health insurance, long-term disability insurance, tuition reimbursements, retiree health care, and early retirement incentives for districts with declining enrollment. Some districts have chosen to pay for the employee’s 6 percent contribution to PERS instead of other potential bargained compensation, such as wages. This analysis follows the consolidation of data used by ODE and includes the 6 percent employer “pick up” as salary.
[14] This analysis modeled total compensation mirroring the methods used by Keefe, and Allegretto & Mishel’s analyses cited earlier in this paper. Average Oregon public-school teacher benefits data was provided by Brian Reeder of the Oregon Department of Education on April 3, 2018. Data on non-public school teacher compensation was calculated from the Bureau of Labor Statistics Employer Cost of Employee Compensation (ECEC) survey data. To ensure temporal consistency between the various datasets, public-school teacher compensation data for 2012-2016, 2012-2016 U.S. Census Bureau American Community Survey data for wages and demographic variables, and 2014 data in the ECEC survey on non-teacher compensation were used. See: Appendix: Methodology.
[15] This analysis also includes the estimated cost of servicing pension obligation bonds. Based on information received by Brian Reeder at the Oregon Department of Education, we estimate that approximately 75 percent of the difference between the full PERS rate and the net PERS rate is lost to debt servicing for these pension obligation bonds. The difference between the full and net PERS rates is driven by the returns on the pension obligation bonds. By only including 25 percent of the benefit from pension obligation bonds, this analysis includes both the costs and benefits to these bonds. Another study that looked at teacher compensation at the district level found servicing pension obligation bonds captured about 5 to 7 percent of the total compensation for a starting teacher. That analysis was limited to only 5 Oregon school districts and cannot be used to develop statewide averages. The case study cited is Phil Keisling, Bob Winthrop, Julia Taylor, and Katelyn Wilkins, Measuring Total Employer Cost of Compensation for Teachers in Eight K-12 Public Schools in Oregon, Washington, and Idaho: A Feasibility study and Discussion of Key Findings, Center for Public Service, Portland State University, 2017.
[16] This is especially true for teachers that were hired more recently. For teachers hired after August 2003, their retirement benefits fall under the Oregon Public Service Retirement Program (OPSRP). This retirement program is less generous than the PERS Tier 2 program for teachers hired between January 1996 and August 2003, and even less so than the Tier 1 program, for teachers hired before January 1996. Because of data constraints, this analysis pools these different retirement programs, making the compensation gap seem smaller than it actually is, particularly for newly hired teachers.
[17] Moro v. State of Oregon, 357 Or. 167 (2015).
[18] Janet Bauer, 3 facts about Oregon’s gender pay gap, OCPP, April 2018.
[19] Asaf Levanon, Paula England, and Paul Allison, Occupational Feminization and Pay: Assessing Causal Dynamics Using 1950-2000 U.S. Census Data, Social Forces (2009) 88 (2), 865-891.
[20] These figures are based on an analysis of the ACS data used for analyzing teacher pay. The teacher distribution matches Oregon Department of Education figures shared for the 2016-2017 school year.
[21] Bethany Barnes, “Most Oregon principals are now women,” Oregonian, 2017.
[22] Women in the Workplace 2017, McKinsey & Company & LeanIn; Nancy Carter & Christine Silva, Women in Management: Delusions of Progress, Harvard Business Review, March 2010.
[23] Op Cit, Jeffrey Keefe, Pennsylvania’s teachers are undercompensated–and new pension legislation will cut their compensation even more, Economic Policy Institute, February 2018; Jeffrey Keefe, New Jersey public school teachers are underpaid, not overpaid, Economic Policy Institute, February 2017; Sylvia Allegretto and Lawrence Mishel, The teacher pay penalty has hit a new high, Economic Policy Institute, September 2018.
[24] Ibid.