Unions are one of the keys to reversing the rise of income inequality, rightly described as the “defining challenge of our time.”[1]
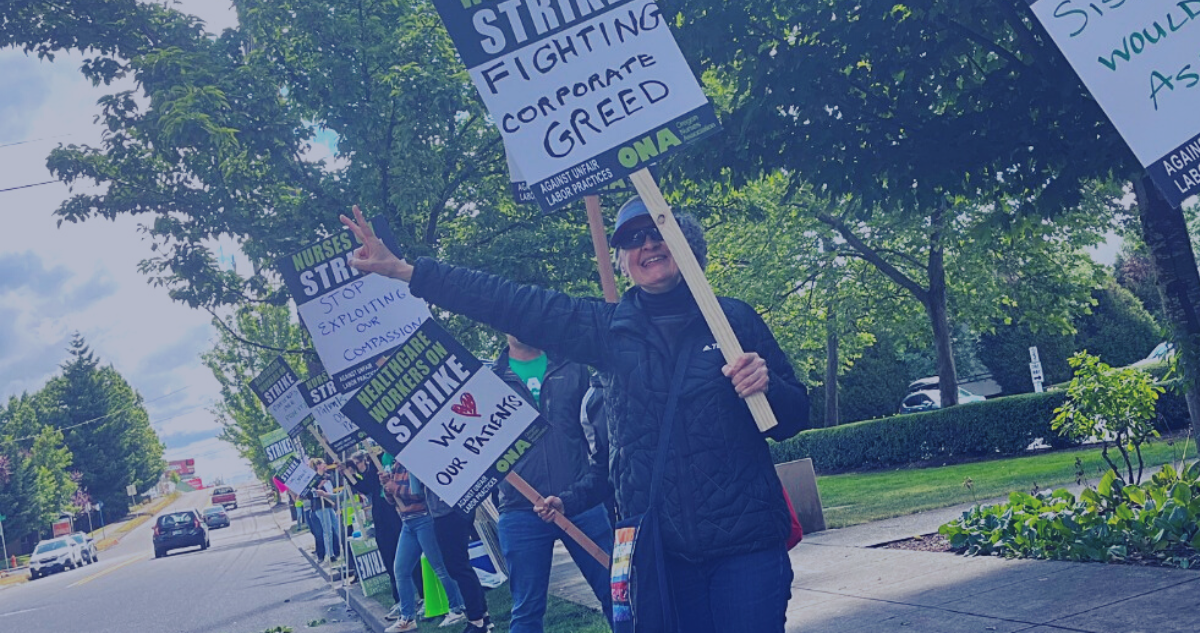
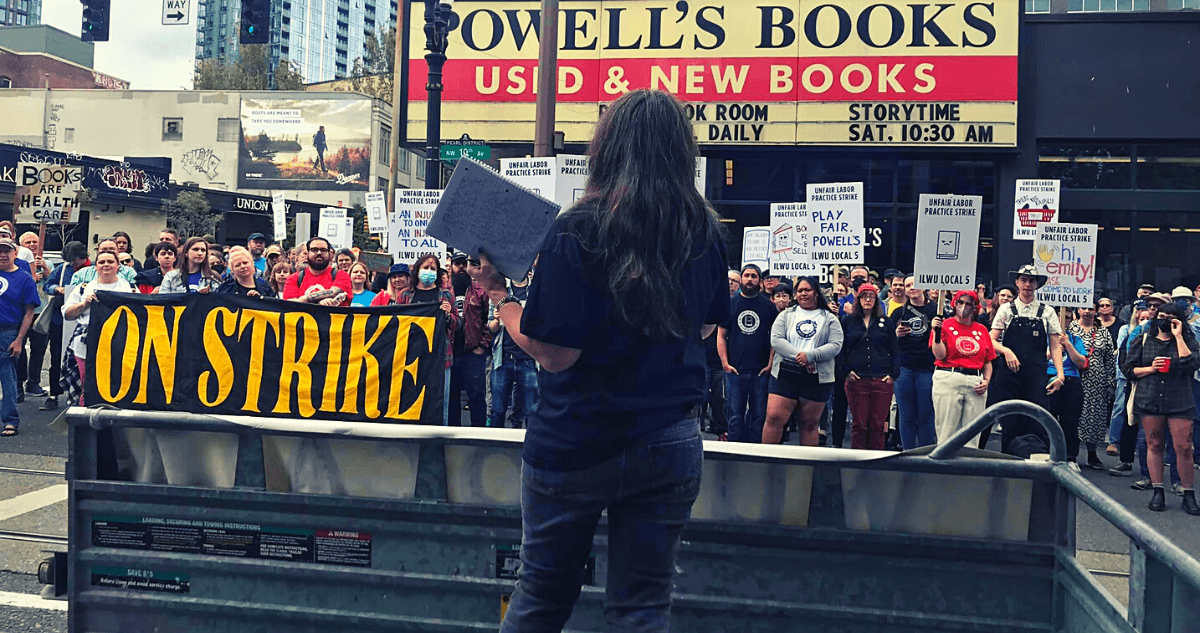
Historically, organized labor has led efforts to create an economy that works for everyone. Unions represent the fundamental right of workers to stick together and demand better pay and working conditions. Union efforts have resulted in worker protections such as child labor laws, safer working conditions, overtime compensation and the 40-hour work week. Following World War II, a vibrant U.S. labor movement helped support the development of a broad middle class by setting standards for wages and benefits.
By the late 1970s, at about the time union membership began to decline nationally and in Oregon, income inequality began to widen.[2] Income gains began bypassing most Oregonians, flowing instead to those at the top of the income scale. The decline in union representation is an important part of the story of the rise of income disparities in Oregon, and of disparities among Oregon men in particular.
By bargaining together for better pay, workers can reduce inequality and create an economy that works for everyone.
Download a copy of this issue brief:
Unions Are Key to Reducing Inequality
Related materials:
Oregon Income Inequality: More Than Three Decades in the Making, Oregon Center for Public Policy, September 1, 2015
Unions Raise Wages for Workers
Unionization raises wages for all workers, especially for those at the bottom and middle of the income scale.[3]
Union representation boosts the wages of Oregon’s lowest paid workers by about 21 percent, while middle-wage workers enjoy an increase of about 17 percent. Even the highest paid workers benefit from unionizing, with a 6 percent increase to their wages.[4]

There is no shortage studies showing both the existence of this union wage premium and its disproportionate benefit for workers at the bottom and middle of the wage scale across the nation.[5]
What does that union wage premium mean in dollar terms? Consider a full-time worker earning the typical (median) wage in Oregon of $17.02 per hour, which translates to about $35,400 per year. Upon joining a union, this worker can expect to earn about $41,200 — an increase of nearly $6,000. For that worker, a 17 percent increase in earnings can mean an easier time paying the rent or saving for a child’s college education.
Nonunionized workers benefit from unionization, as well. In industries where unions are prevalent, even nonunionized workers receive higher wages than similar workers in less unionized industries. This is because the presence of unions in an industry can induce nonunion employers to raise wages and benefits to forestall unionizing campaigns and to compete for employees. Likewise, unions can set standards for safety and benefits for all workers in an industry.[6]
Union Membership Has Declined In Recent Decades
Unfortunately, union membership in Oregon has dwindled in recent decades.
In 1979, unions represented 33 percent of the Oregon workforce.[7] By 2006, shortly before the start of the Great Recession, the figure had declined to 15 percent.
The share of unionized workers increased somewhat during the Great Recession, when non-union workers more quickly lost jobs. The share subsequently declined, however, as non-union jobs returned with the strengthening economy following the recession. By 2014, about 17 percent of Oregon workers were represented by a union.[8]

The largest losses in union representation have occurred in the private sector, which employs over 80 percent of Oregon workers.[9] In 1983, 18 percent of Oregon private sector workers had union coverage. By 2014, that share had fallen to just 9 percent. Over the same period, trends in public sector unionization remained relatively stable.[10]
The decline in historically heavily unionized industries in Oregon such as construction and manufacturing, together with obstacles confronting workers trying to organize in emerging industries, largely account for the drop in the unionization rate in the state.
Over the past two decades in particular, private sector employers across the country have taken aggressive action to oppose workers’ efforts to organize. Anti-union campaigns have included coercive and punitive tactics such as threats of plant closings, actual plant closings, discharges, harassment, disciplinary action, surveillance and alteration of benefits and working conditions.[11] Workers in Oregon seeking to unionize appear to face such practices, judging from unfair labor practices cases filed with federal officials against Oregon employers and from press reports.[12]
Decline in Unionization Has Helped Fuel Growth in Inequality
For more than three decades, income gains have bypassed most Oregonians and flowed primarily to those at the top of the income scale. “Income” includes earnings from work as well as unearned income, such as profits from investments. In 2013, the wealthiest 1 percent of Oregonians made $770,000 on average, more than double their inflation-adjusted income in 1979. Meanwhile, the Oregon household at the middle of the income scale (the median or “typical” household) earned $32,537 in 2013, about $1,500 less than in 1979 when accounting for inflation.[13]
For low- and middle-income workers, employment is the main source of income, and these workers have seen wages erode.[14] From 1979 to 2014, the hourly wage of the typical (median) Oregon worker declined from $17.79 to $17.02, when adjusted for inflation. The lowest paid workers (those at the 10th percentile) also experienced a drop from $9.48 to $9.18. By contrast, the inflation-adjusted hourly wage of the highest paid workers (those at the 90th percentile) rose from $32.52 in 1979 to $40.15 in 2014.[15]
The decline in wages has been particularly pronounced among men, who historically have dominated highly unionized industries such as construction and manufacturing. These sectors have experienced disproportionate declines in unionization.[16]

Inflation-adjusted wages for median-wage men (those at the 50th percentile) fell 19 percent from 1980 to 2014, from $22.24 to $17.95 per hour. By contrast, wages for men at the 90th percentile increased 26 percent over the same period, from $35.38 to $44.41 per hour.[17]
In contrast to their male counterparts, compensation of middle-wage women increased somewhat since 1980. But inequality among women overall grew nonetheless: highest-paid women (at the 90th percentile) saw wages increase more than three times as fast as women in the middle.[18]
The decline in unionization helps explain the rise in income inequality in Oregon. As previously noted, unions raise the wages of modest-income workers more than higher income workers. And depending on their density within an industry, unions can indirectly raise compensation for non-unionized workers.[19] Researchers have found the decline in unionization accounts for one-third of the rise in wage inequality among men and one-fifth among women.[20]
Because wages comprise the majority of income for low- and middle-income individuals, it comes as no surprise to find that trends in income inequality in Oregon track unionization rates.
Specifically, as unionization in Oregon declined by more than half between 1979 and 2013 (going from about 33 percent to 15 percent), the share of total Oregon income going to low- and middle-income households (the bottom 60 percent) fell by more than one-fifth (going from about 25 percent to 20 percent).

Conclusion
More than three decades ago, at about the time union membership began to decline nationally and in Oregon, income inequality began to widen. Income gains began flowing to those at the top of the income scale, while bypassing most other Oregonians.
The decline in union representation is an important part of the story of the rise of economic inequality in Oregon. Increased unionization would ease inequality and help low- and middle-income Oregonians prosper.
[1] President Barack Obama, “Remarks by the President on Economic Mobility,” December 4, 2013, available at https://www.whitehouse.gov/the-press-office/2013/12/04/remarks-president-economic-mobility.
[2] Stone, Chad; Danilo Trisi; Arloc Sherman and Brandon DeBot. A Guide to Statistics on Historical Trends in Income Inequality, Center on Budget and Policy Priorities, revised July 15, 2015, available at: http://www.cbpp.org/sites/default/files/atoms/files/11-28-11pov.pdf. Also, Oregon Income Inequality: More than Three Decades in the Making, Oregon Center for Public Policy, September 1, 2015, available at http://www.www.ocpp.org/2015/09/01/fs20150901-oregon-income-inequality-decades/.
[3] “Bottom” or “lowest” refers to workers at the bottom 10th percentile of the wage scale; “middle” or “median” refers to workers at the 50th percentile. “Modest” refers to both lowest- and middle-wage workers. “Highest” refers to workers at the 90th percentile of the wage scale.
[4] The union wage premium for Oregon workers at the 10th percentile is 21.1 percent, 16.5 percent at the 50th percentile and 5.8 at the 90th percentile. John Schmitt. The Union Advantage for Low-Wage Workers, Center for Economic and Policy Research, May 2008, available at http://www.cepr.net/documents/publications/quantile_2008_05.pdf.
[5] See Mishel, Lawrence. Unions, Inequality, and Faltering Middle-Class Wages, Economic Policy Institute, August 29, 2012, available at http://s2.epi.org/files/2012/ib342-unions-inequality-middle-class-wages.pdf. See also literature references in Mishel report.
[6] Western, Bruce and Jake Rosenfeld. Unions, Norms, and the Rise of U.S. Wage Inequality, American Sociological Association, 76(4) 513-537, available at http://www.asanet.org/images/journals/docs/pdf/asr/WesternandRosenfeld.pdf. See also Mishel, Lawrence and Matthew Walters. How Unions Help All Workers, Economic Policy Institute, August 2003, available at http://s4.epi.org/files/page/-/old/briefingpapers/143/bp143.pdf.
[7] Figures on unionization rates reflect union members and nonunion workers covered by a union contract. Data on union coverage density by state starts at 1977. Data shown in this report begins with 1979 for consistency with state wage data shown in the report elsewhere. UnionStats.com, available at unionstats.com.
[8] OCPP analysis of Current Population Survey data obtained from UnionStats.com.
[9] In 2014, the private sector employed 84 percent of Oregon workers, while the public sector employed 16 percent. UnionStats.com.
[10] In 1983, 59 percent of Oregon public sector workers were represented by a union. That share fluctuated between 52 and 65 percent since that time. By 2014, 57 percent were represented. Source of union data shows data by state industry sector beginning in 1983. UnionStats.com.
[11] Bronfenbrenner, Kate. No Holds Barred: The Intensification of Employer Opposition to Organizing, Economic Policy Institute, May 20, 2009, available at: http://s3.epi.org/files/page/-/pdf/bp235.pdf.
[12] Between 1979 and 2010, 227 cases on average per year alleging unfair labor practices against Oregon employers were filed with the National Labor Relations Board. Complaints of employer unfair anti-union practices are described in The Oregonian news reports: “Labor activists demonstrate against Providence,” March 21, 2007; “She talked up union; she’s out of a job,” June 4, 2013; “Precision Castparts workers prepare for landmark Machinists union vote,” June 4, 2013.
[13] OCPP analysis of Oregon Department of Revenue data.
[14] Gould, Elise; Alyssa Davis and Will Kimball. Broad-based Wage Growth is a Key Tool in the Fight Against Poverty, Economic Policy Institute, May 20, 2015, available at http://s2.epi.org/files/2015/broad-based-wage-growth-is-a-key-tool-in-the-fight-against-poverty.pdf. Also, Oregon Income Inequality: More than Three Decades in the Making, Oregon Center for Public Policy, September 1, 2015.
[15] OCPP analysis of Current Population Survey data. Data adjusted for inflation to 2014 dollars using CPI-U-RS.
[16] In 1983, 35 percent of construction workers had the benefit of collective bargaining. By 2014, just 19 percent had such protection. Likewise, in 1983, 30 percent of manufacturing employees were represented. By 2014, that share had fallen to just 9 percent. UnionStats.com.
[17] OCPP analysis of Current Population Survey data, adjusted to 2014 dollars using CPI-U-RS. Wage data cited in graph and text for Oregon men and women starts at 1980, the first year data is available by decile for both groups.
[18] Between 1980 and 2014, wages for women at the 50th percentile increased 17 percent, from $13.51 to $15.81 per hour, adjusted for inflation using CPI-U-RS. Wages for women at the 90th percentile increased 58 percent from $23.13 to $36.43 per hour, when adjusting for inflation. Despite the gains for women and decline for middle-wage men, wages in 2014 for both groups of women remained below that of their male counterparts. OCPP analysis of Current Population Survey data.
[19] Mishel, Lawrence. Unions, Inequality and Faltering Middle-class Wages, Economic Policy Institute, August 29, 2012.
[20] Mishel, Lawrence. Ibid. Also, Western, Bruce and Jake Rosenfeld. Unions, Norms, and the Rise in U.S. Wage Inequality, American Sociological Review, (2011) 76(4), 513-537; see page 528.