This fact sheet is also available as a PDF: A Portrait of Poverty in Oregon
Before the coronavirus (COVID-19) spread to Oregon, poverty afflicted all corners of the state. More than one in 10 Oregonians lived below the federal poverty line before the coronavirus economic crisis. But that figure masks significant differences in poverty levels among different Oregon communities. Certain groups — people of color, women, Oregonians with a disability, and rural communities — face greater obstacles to rise above the federal poverty line.
Moreover, the federal definition of poverty understates the extent of economic hardship in Oregon. The poverty guidelines were originally established in the 1960s based on food prices. [1] As such, it fails to account for the rising cost of housing, health care, child care, and other basic needs. For 2020, a family of four is considered to be living in poverty if they earn less than $26,200 a year. [2]
After months of uncertainty and economic turmoil unleashed by the pandemic, it is tempting to yearn for a return to normal. It is easy to look at our past economy with rose-colored glasses. But even before the coronavirus ground the economy to a halt, “normal” for many Oregonians meant struggling to make ends meet. A return to normal is not good enough.
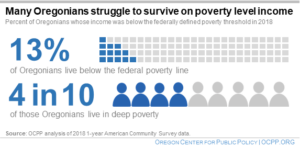
In 2018, after eight years of uninterrupted economic growth, Oregon’s poverty rate stood at 13 percent, meaning that more than one in 10 Oregonians met the official definition of poverty and likely lacked one or more basic needs. [3] This represents more than 516,000 Oregonians, including 134,000 children. Of those Oregonians living in poverty, four in 10 lived in what some experts refer to as “deep poverty” — income that is less than half of the poverty guideline. [4] For a family of four in 2018, that meant trying to survive on only $13,100 a year, or less than $1,100 a month. That family is likely unable to adequately meet most if its basic needs.
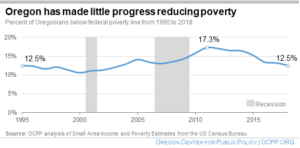
While poverty has ebbed and flowed over the years, Oregon’s poverty rate in 2018 stood at the same level as in 1995, when the data series begins. Even during times of economic prosperity, poverty in Oregon has not dropped below 10 percent in recent decades. [5]
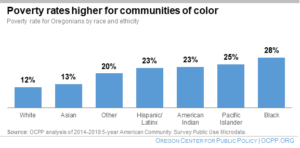
Before the pandemic, Oregonians of color already confronted significant barriers to getting ahead. The nation’s long history of racial oppression and exclusion, coupled with ongoing patterns of discrimination, have meant that people of color disproportionately work in low-paying jobs and in jobs that lack stability. [6] As a result, poverty rates in communities of color were as much as double the poverty rate for white Oregonians from 2014-2018. [7] This means that about one in four Black, Pacific Islander, American Indian, and Latino Oregonians fell below the federal poverty threshold and were consequently denied many of the fundamental economic opportunities available to others.
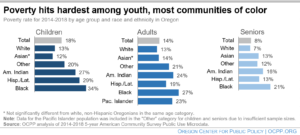
Children are the hardest hit by poverty of any age group. From 2014-2018, Oregon’s child poverty rate was nearly 18 percent, meaning that nearly one in five children in Oregon lived below the poverty line. By comparison, 14 percent of working-age adults and eight percent of seniors fell below the poverty line during that time period. [8]
Poverty among children has particularly harsh long-term consequences. Researchers have found a causal relationship between very low incomes and children’s achievement in school, as well as lower earnings later in life. [9]
Historic inequities have created barriers for children of color that exacerbate their family’s poverty rates. In Oregon, more than one in four American Indian and Latino children, and more than one in three Black children, lived in poor households from 2014-2018. Nationally, children of color, especially Black and American Indian children, are also much more likely to live in high-poverty neighborhoods, or what is known as concentrated poverty. [10] This is due to historic practices like red-lining, as well as current laws and practices that replicate and reinforce past discrimination. Concentrated poverty results in these children growing up in communities that lack the resources that children need to thrive – like quality schools and safe places to play[11]
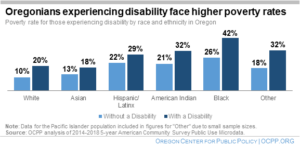
During even the best of times, people experiencing disability face structural barriers to getting ahead. [12] Federal and state law allow certain federally qualified employers to pay people experiencing disabilities a sub-minimum wage. [13] Although the Oregon legislature recently took action to phase out this lower wage level in Oregon, workers experiencing disability will not be guaranteed the same wage floor as all other workers until 2023. [14]
Because of structural barriers like this, over one in five people experiencing disability had income below the poverty guidelines from 2014-2018. Nearly half of Black women who are experiencing disability lived in poverty.
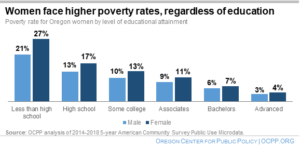
Poverty rates also differ between men and women in Oregon. From 2014-2018, the share of women experiencing poverty was 15 percent, while the poverty rate for men was less than 13 percent. This gap existed between women and men regardless of educational attainment. A higher rate of poverty among women appeared at every level of education as compared to men. Higher poverty rates for women may be due, in part, to the fact that women’s wages lag behind those of men, and women are overrepresented in industries that pay the minimum wage. [15]
High poverty also afflicts transgender Oregonians
While the Census does not provide options for identifying outside of the male/female binary, and does not include questions regarding sexual orientation or gender identity, a different data source shows that transgender, nonbinary, and genderqueer Oregonians face real barriers. According to the 2015 U.S. Transgender Survey, 30 percent of transgender Oregonians lived in poverty in 2015. [16]
The report said that anti-trans discrimination fueled economic disparities, with one in five trans Oregonians reporting being fired from a job because of their gender identity or expression, and nearly a third of those employed or seeking employment reporting other forms of discrimination.
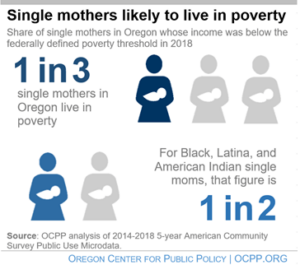
More than one in three single mothers in Oregon lived below the poverty line from 2014-2018. [17] For Black, American Indian, or Latina single mothers, that figure was one in two. In total, there were about 36,000 single mothers in Oregon trying to survive with poverty level incomes.
The high cost of child care poses a formidable barrier for single mothers seeking to rise above poverty. The average annual cost of child care at a center for an infant in Oregon is over $14,000 a year. [18] The high cost of child care can discourage single mothers from joining the work force.
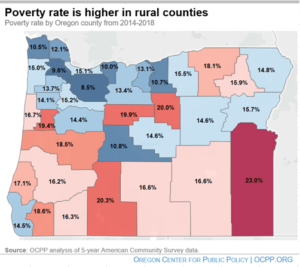
Greater proportions of people experience poverty in Oregon’s rural areas. [19] From 2014-2018, the poverty rate was more than 16 percent among rural Oregonians, compared to the 14 percent rate for Oregonians living in urban areas. The highest poverty rate in Oregon is in Malheur County, where nearly one in four residents has income below the poverty level.
Rural areas have higher unemployment rates, a lower minimum wage floor, and substantially lower per capita personal income than urban areas. These factors likely contribute to higher levels of poverty. [20]
Conclusion
Even during the best of times, Oregon has left far too many people behind. In 2018, the poverty rate in Oregon stood at the same level as it did more than two decades ago. Throughout this period, more than one in 10 Oregonians lived below the federal poverty line — itself a measure that understates real economic need. Particular populations — Oregonians of color, rural Oregonians, Oregonians experiencing disability, women, single mothers, and children — have faced bigger barriers to rise out of poverty. As Oregon charts a path out of the COVID-19 crisis, it’s clear that a return to the pre-pandemic state of affairs is not good enough.
[1] The poverty guidelines are adjusted each year based on the Consumer Price Index. Office of the Assistant Secretary for Planning and Evaluation (ASPE), US Department of Health and Human Services, Frequently Asked Questions Related to the Poverty Guidelines and Poverty.
[2] Oregon Center for Public Policy, What is Poverty?, February 4, 2020.
[3] OCPP analysis of 2018 American Community Survey data, table S1701.
[4] Serena Lei, “The Unwaged War on Deep Poverty”, The Urban Institute, December 2013.
[5] OCPP analysis of Small Area Income and Poverty Estimate (SAIPE) Data. This data set provides a longer term view of poverty in Oregon than American Community Survey (ACS) data, as it is adjusted and combined with Current Population Statistics poverty data that has been collected for a longer period of time. 2018 SAIPE and ACS poverty rates used elsewhere in this report differ slightly due to the adjustments made when combining datasets. More information on SAIPE available here.
[6] David Cooper, “Workers of color are far more likely to be paid poverty-level wages than white workers”, Economic Policy Institute, June 2018; and Christian E. Weller, “African Americans Face Systemic Obstacles to Getting Good Jobs”, Center for American Progress, December, 2019.
[7] This paper relies on OCPP analysis of American Community Survey 2014-2018 Public Use Microdata Sample. All disparities highlighted in this paper were statistically significant at the 95 percent level when compared to non-Hispanic whites. As used in this paper “communities of color” refers to all respondents who identify as something other than non-Hispanic or Latino white. Wherever possible this paper separates out data for the Native Hawaiian or Pacific Islander population, referred to as “Pacific Islander.” Where sample sizes were too small for reliable results, data for Native Hawaiian or Pacific Islanders were included in the “Other” category, rather than grouping them with the “Asian” category, and is noted in charts. This is because Native Hawaiian or Pacific Islanders face economic disparities much greater than that of the broader “Asian” category, and more in line with the “Other” category for those measures where sample sizes were large enough. We did not want to lose this nuance by grouping them as an “Asian American and Pacific Islander” category. “Other” also includes all respondents who selected two or more races. All race categories exclude those who identify as Hispanic or Latino, which are aggregated into a single category.
[8] This report defines “children” as those age 17 and younger, “working-age adult” as those age 18 to 64, and “elderly adult” as those age 65 and older.
[9] Greg J. Duncan and Katherine Magnuson, The Long Reach of Early Childhood Poverty, Pathways, Winter, 2011.
[10] Annie E. Casey Foundation, Children Living in High-Poverty, Low-Opportunity Neighborhoods, 2019.
[11] Ibid.
[12] Laura Chabot, “Institutional Barriers to Employment for Individuals with Disabilities”, University of Rhode Island, 2013.
[13] For more information on the subminimum wage see the Department of Labor website.
[14] Senate Bill 494, 2019 Regular Session.
[15] Oregon Center for Public Policy, Portrait of Minimum Wage Workers, December 19, 2019.
[16] Sandy E. James, Jody L. Herman, Susan Rankin, et al., 2015 U.S. Transgender Survey, National Center for Transgender Equality, December 2016. For information on Oregon specific data see the Oregon breakout report.
[17] As used in this report single mother refers to unmarried women who live in a household with their minor children. This excludes women who are parenting non-related children, such as foster children.
[18] Deana Grobe and Roberta B Weber, 2018 Oregon Child Care Market Price Study, March 2018.
[19] This report considers counties to be “rural” if they are characterized as nonmetropolitan by federal data sources. The following counties are considered rural: Baker, Clatsop, Coos, Crook, Curry, Douglas, Gilliam, Grant, Harney, Hood River, Jefferson, Klamath, Lake, Lincoln, Malheur, Morrow, Sherman, Tillamook, Umatilla, Union, Wallowa, Wasco, and Wheeler.
[20] Oregon Employment Department, The Employment Landscape of Rural Oregon, May, 2017.