Taxes are lower in Oregon than in most other states. Specifically, Oregon trails nationally in the amount of state and local taxes paid as a share of state personal income.
Oregon, however, ranks high in terms of fees — tuition fees, for example. It’s these high fees that lift Oregon above the national average in state and local revenue collection as a share of personal income.
Oregonians Pay Less in Taxes than the National Average
What share of Oregon personal income goes to supporting the state and local services all Oregonians count on?[1]
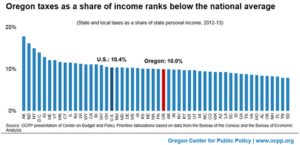
When looking strictly at tax revenues, both state and local, as a share of personal income, Oregonians pay below the national average. (See methodology notes below for explanation of the use of personal income as basis for analysis). For fiscal year 2012-13 — the year with the most recent available data — state and local taxes accounted for 10.0 percent of Oregon personal income, below the national average of 10.4 percent.[2]
What Matters Is the Adequacy, Not Ranking, of a Revenue System
It is the adequacy of our tax system, not Oregon’s ranking, that ought to concern policymakers and other Oregonians.
That said, this paper explains Oregon’s ranking for those examining it.
Oregonians Pay More in Fees than the National Average
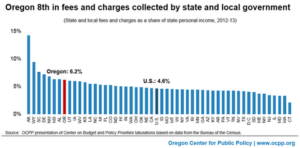
Oregon state and local governments collect more in charges and fees as a share of personal income than most states. In fiscal year 2012-13, Oregon state and local governments collected 6.2 percent of personal income in the form of charges and fees, higher than the national average of 4.6 percent. Only seven states collected a higher share of personal income in the form of charges and fees.
Charges and fees are money governments receive in exchange for providing certain services. Tuition paid by students at public universities, hospital charges paid by health insurance providers, sewage access fees paid by residents, and charges to use airports such as landing fees paid by pilots or terminal rentals paid by airlines are some of the larger charges and fees collected by state and local governments in Oregon.
It’s High Fees that Bring Oregon’s Revenues Above Average
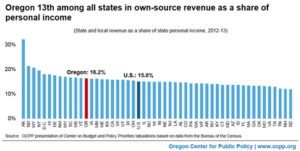
When considering both state and local taxes and charges and fees, for fiscal year 2012-13 Oregon’s “own source” general revenue accounted for 16.2 percent of the state’s personal income, ranking Oregon 13th among all states. This share was above the national average of 15.0 percent.
“Own-source” general revenue refers to all state and local taxes, fees, charges and miscellaneous revenue collected by state and local governments for general purposes. Own-source general revenue does not include funds received from the federal government. It also excludes “non-general” revenue, money typically set aside for particular expenditures that, for good reason, are accounted for separately from general government expenditures. Employer contributions to the unemployment insurance system are one example.
The amount of own-source general fund revenue collected by Oregon state and local governments has remained fairly constant over the years, hovering around 16 percent of personal income since 1980.
Conclusion
How Oregon compares to other states in terms of taxes comes up often in policy discussions, even though that inquiry ignores the more important question of whether Oregon adequately funds its schools, transportation infrastructure and other key public services.
For those who think rankings are important: Oregon taxes are below average, while charges and fees are high relative to other states.
Methodology Notes
There is no single way of comparing state and local tax systems. One approach — the better approach — is to measure state and local revenue as a share of total personal income, as this issue brief does. Another, less satisfactory, way is to calculate revenue per capita (or per person).
Measuring revenue on a per capita basis conflates two elements: tax rates and income levels.
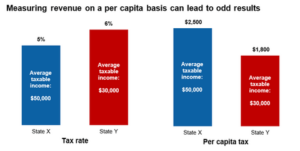
To illustrate the problem of using per capita for comparisons, consider income taxes in two hypothetical states, one with high incomes — let’s say averaging $50,000, and one with lower incomes averaging $30,000. A per capita method would be based on such state average taxable income figures.
Let’s say state X has an income tax rate of 5 percent and average taxable income of $50,000.[3] For State X, the per capita tax would be $2,500 (5 percent times $50,000).
State Y has a higher income tax rate, 6 percent, and the lower average taxable income, $30,000. In this instance, the per capita tax would be $1,800 (6 percent times $30,000).
In this example, even though the tax rate is higher in State Y (6 percent vs 5 percent), a per capita ranking would show this state as having “lower taxes” ($1,800 vs. $2,500), which would be misleading.
In addition, states with higher average incomes may have a higher cost of living and higher wage levels, making it relatively more expensive to fund a given level of services than in states with a lower cost of living and lower wage levels. Calculating state and local revenue as a share of personal income provides a more relevant assessment of what a state asks people to pay.
That said, even this methodology is not without wrinkles. For example, under the methodology used in this paper, Alaska’s share of revenue collections relative to personal income far exceeds other states. But much of this revenue comes from corporations extracting oil from public lands, not from the pocketbooks of individual Alaskans. However, it is important to include this revenue when comparing state and local taxes because it goes toward funding public services in Alaska.
A final note: this analysis makes public services appear more costly as a share of income than they actually are, to some degree. This is the result of having to use differing data sources. The U.S. Bureau of Economic Analysis data used here to measure total state personal income does not include income from capital gains or corporate income. However, the U.S. Census Bureau data used to calculate total state revenue collections does include taxes paid on capital gains income and taxes paid by businesses and corporations. As a result, this analysis overstates the revenue collected by state and local governments in relation to a state’s personal economic capacity.
[1] The Bureau of Economic Analysis defines personal income as, “income received by, or on behalf of, all residents of an area.” Notably, it does not include income from capital gains. For more see, “Local Area Personal Income Methodology,” Bureau of Economic Analysis, available at https://www.bea.gov/regional/pdf/lapi2012_050914.pdf.
[2] Center on Budget and Policy Priorities tabulations based on data from the Bureau of the Census and Bureau of Economic Analysis. In this instance, and throughout this analysis, a ranking of first means that a state has the highest percent of personal income collected in state and local government revenue.
[3] For the purpose of this example, it doesn’t matter whether the tax rate is an average tax rate among all taxpayers or a single flat tax rate.