The money we pay in fees and taxes helps create jobs, build a strong economy, and preserve Oregon’s quality of life. It does this by educating our children, keeping our communities safe, and providing health care and many other vital services.
Unfortunately, how Oregon ranks relative to other states in terms of how much state and local governments raise to support the common good often comes up in political debates. Such comparison is rather meaningless, because how Oregon ranks relative to other states fails to inform whether revenue collections are sufficient to support the public structures that create opportunity and the quality of life that Oregonians desire and expect.
But to set the record straight, this issue brief shows that, as a share of total personal income, Oregon collects revenue at slightly below the national average. When considering only tax collections, Oregon ranks near the bottom. It is the collection of charges and fees that moves Oregon up to the middle of the pack.
Download a copy of this report
Oregon: Where Taxes are Low, Fees are High and Revenue Is Slightly Below Average (PDF)
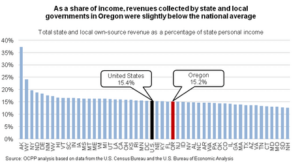
As Share of Income, Oregon Collects Revenue at Slightly Below National Average
What share of total personal income in Oregon goes to support the services provided by state and local governments?
In fiscal year 2008-09, “own-source” general revenue collected by Oregon state and local governments added up to 15.2 percent of total personal income. That share is just below the national average of 15.4 percent.[1] In essence, Oregon placed in the middle of the pack among all states and the District of Columbia in terms of own-source general revenue as a share of personal income.[2]
“Own-source” general revenue refers to all state and local taxes, fees, charges and miscellaneous revenue collected by state and local governments for general purposes. Own-source general revenue does not include funds received from the federal government. It also excludes “non-general” revenue, money typically set aside for particular expenditures that, for good reason, are accounted for separately from general government expenditures. Employer contributions to the unemployment insurance system are one example.
The amount of own-source general fund revenue collected by Oregon state and local governments has remained fairly constant over the years, hovering around 15 percent of personal income since 1980.[3]
Fees, Not Taxes, Make Oregon about Average
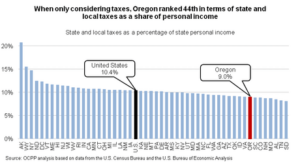
When looking at state and local taxes alone, Oregonians pay little compared to other states. In fiscal year 2008-09, state and local governments’ taxes equaled 9 percent of Oregon personal income, well below the national average of 10.4 percent. That year, only seven other states collected a smaller share of personal income in the form of state and local taxes.[4]
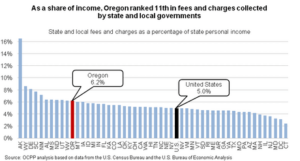
State and local governments in Oregon collect more in fees and charges as a share of personal income compared to most other states. In fiscal year 2008-09, Oregon state and local governments collected 6.2 percent of personal income in the form of charges and fees, substantially above the national average of 5 percent. Only 10 other states collected a higher share of personal income through charges and fees.[5]
As a share of total personal income, low taxes and high fees and charges relative to other states combine to place Oregon’s revenue collections in the middle of the pack.
Although data employed in this analysis does not include revenue from Measures 66 and 67, it’s unlikely that the tax measures moved Oregon from its middle ranking relative to the nation. Still Middle of the Pack with Measures 66 and 67
The most recently available Census data do not take into account revenue collections from Measure 66 and 67. That data are for fiscal year 2008-09, which runs from July 1, 2008 through June 30, 2009. Voters enacted Measures 66 and 67 in January 2010. Though the measures applied to tax year 2009, revenue collection from the measures would not have started yet in June 2009.
Nevertheless, it is possible to come up with a reasonable approximation of the impact of Measures 66 and 67. The Legislative Revenue Office’s (LRO) latest estimate of revenue raised in tax year 2009 is $131.1 million from Measure 66 and $112.8 million from Measure 67.[6] Assuming that the amount for fiscal year 2008-09 was the same as for the LRO estimate for tax year 2009, state and local taxes would amount to 9.2 percent (rather than 9.0 percent) of Oregon personal income and the state would rank 41st (rather than 44th) among all states and the District of Columbia. Total own-source general revenue would be 15.4 percent (rather than 15.2 percent) of personal income and by this measure Oregon would rank 26th (rather than 29th).
Share of Personal Income Vs. Revenue Per Capita, and Other Notes
Some explanation of the data and methodology underlying this analysis is in order.
There is no one way of comparing state and local tax systems. One approach — the better approach — is to measure state and local revenue as a share of total personal income, as this issue brief does. Another, less satisfactory, way is to calculate revenue per capita (or per person).
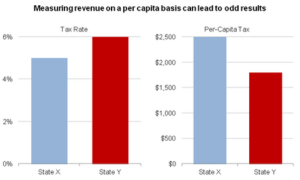
Measuring revenue on a per-capita basis conflates two separate elements: tax rates and income levels. To illustrate the problem of using per capita for comparisons, consider income taxes in two hypothetical states, one with high incomes (averaging $50,000) and one with lower incomes (averaging $30,000).
State X has an income tax rate of 5 percent [7] and an average taxable income of $50,000. For State X, the per-capita tax would be $2,500 (5 percent times $50,000).
State Y has a lower average taxable income, $30,000, and a higher income tax rate, 6 percent. In this instance, the per-capita tax would be $1,800 (6 percent times $30,000).
In this example, even though the tax rate is higher in the lower income state (State Y), a per-capita ranking would show the state with the higher taxes as having “lower taxes” ($1,800 vs. $2,500).
In addition, states with higher average incomes may have a higher cost of living and higher wage levels, making it relatively more expensive to fund a given level of services than in states with a lower cost of living and lower wage levels. Calculating state and local revenue as a share of personal income provides a more relevant assessment of what a state asks people to pay.
That said, even this methodology is not without wrinkles. For example, under the methodology used in this paper, Alaska’s share of revenue collections relative to personal income far exceeds other states. But much of this revenue comes from corporations extracting oil from public lands, not from the pocketbooks of individual Alaskans. However, it is important to include this revenue when comparing state and local taxes because it goes toward funding public services in Alaska.
Finally, to some extent this analysis makes public services appear more costly as a share of income than they actually are. This is the result of having to use differing data sources. The U.S. Bureau of Economic Analysis data used here to measure total state personal income does not include income from capital gains or corporate income. However, the U.S. Census Bureau data used to calculate total state revenue collections does include taxes paid on capital gains income and taxes paid by businesses and corporations. As a result, this analysis overstates the revenue collected by state and local governments in relation to the economic resources available.
Conclusion
As a share of income, Oregon — state and local governments combined — collects revenue at slightly below the national average. Further, Oregon ranks near the bottom in terms of the share of personal income collected in the form of state and local taxes. It is the collection of charges and fees that lifts Oregon to the middle of the pack.
All that said, how Oregon ranks relative to other states fails to inform whether revenue collections are sufficient to support the public structures that create opportunity and the quality of life that Oregonians desire.
[1] OCPP analysis of data from the U.S. Census Bureau and the U.S. Bureau of Economic Analysis (BEA). Revenue data is from the Census Bureau. Personal income data is from the BEA and can be found at http://www.bea.gov/regional/sqpi/.
[2] In this instance, and throughout this analysis, a ranking of first would mean that a state has the highest percent of personal income collected in state and local government revenue.
[3] Oregon Center for Public Policy, Tax Day Reality Check: Oregon Revenue and Spending Have Remained Stable, April 14, 2010.
[4] OCPP analysis of Census and BEA data.
[5] OCPP analysis of Census and BEA data.
[6] Oregon Legislative Revenue Office, presentation to Oregon Senate Finance and Revenue Committee, November 17, 2011.
[7] For the purpose of this example, it doesn’t matter whether the tax rate is an average tax rate among all taxpayers or a single flat tax rate.
More about: oregon tax rank, personal income, rankings don’t matter, revenue