Read this report as a PDF: Wages Rise, But Many Workers See No Long Term Progress
Oregon workers are finally seeing a modest boost in their hourly pay, due to recent increases in the state’s minimum wage and a tightening market for labor. But for many, the progress does little to change the picture of stagnant wages over the long term. The long view also shows that women continue to be paid a fraction of what men earn and unionized workers consistently earn more than non-union workers.
Lower wage workers see largest bump in hourly pay
After several years of depressed wages following the Great Recession, real wages for many Oregon workers have begun to rise. [1]
Lower wage workers have gained the most. After adjusting for inflation, the hourly wage for the worker at the 20th percentile rose from $10.64 in 2013 to $11.93 in 2017 — an uptick of 12.1 percent. The wage for this group grew faster than for workers at all other rungs of the wage ladder.[2] For comparison, wage growth for the typical Oregon worker (the worker at the 50th percentile) posted a 5.8 percent increase between 2013 and 2017.
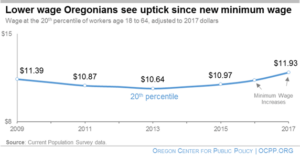
Two factors have helped drive the wage gains. The first is Oregon’s strengthening economy. With unemployment low, employers increase wages to attract workers in a more competitive labor environment.[3] The second is the multi-year increases in Oregon’s minimum wage that started in 2016, lifting the wage floor for the lowest-earning workers.[4]
Wage inequality is growing in Oregon
While the recent gains are good news, over the long run wages are stagnant for those in the middle and bottom. For these workers, the recent gains do little to alter the trends over decades. Over the long-haul, only higher earners have enjoyed any meaningful increase in their wages.
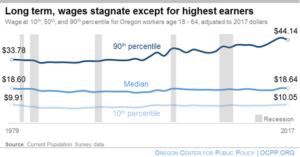
From 1979 to 2017, wages for the worker at the lowest decile (10th percentile) inched up just $0.14 an hour, after adjusting for inflation. That is an increase of just 1.4 percent over nearly four decades. Progress for the typical Oregon worker (at the 50th percentile, or “median”) was even worse, increasing just $0.04 or 0.2 percent over those 38 years. However, for the worker at the 90th percentile, wages increased by 30.7 percent, giving them an additional $10.36 an hour in inflation-adjusted wages.[5]
By definition, these wage figures do not account for other employment compensation (such as bonuses) and income from investments, which top earners are more likely to receive. Indeed, rising inequality in wages is just one part of the larger problem of growing income inequality in Oregon.[6]
Oregon women are paid less than men
Overall, Oregon women are paid less per hour than men. In 2017, the median wage for women was 16 percent less than the wage for men, at $16.74 compared to $19.94.
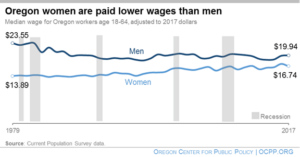
Women in Oregon have long experienced a gap in their hourly pay with respect to men. Over the decades since 1979, women have gained ground in equitable wages.[7]
Unionized workers command higher wages
Unionized workers in Oregon earn higher wages than non-unionized workers. In 2017, the median union worker made nearly $5 more per hour than the median non-union worker — a 28 percent advantage for the unionized worker.
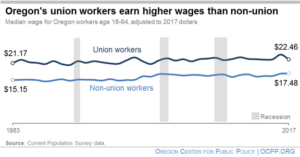
The wage differential commanded by union workers in Oregon has proved to be durable. The typical union worker in Oregon earned wages at least 30 percent higher most years since 1983.[8]
Conclusion
A tightening labor market and minimum wage increases have begun to push wages up for Oregon workers, especially lower-wage workers. However, the picture remains one of stagnant wages over the long term for low- and middle-wage workers. The data also shows that women continue to be paid substantially less than men, and unionized workers continue to earn more than non-unionized workers by a sizable margin.
[1] Figures in this publication are from wage data obtained from the Economic Policy Institute, which uses data from the Current Population Survey. “Real” wage comparisons are those where figures are adjusted for inflation. The inflation adjustments made in this publication use the Bureau of Labor Statistics, CPI-U-RS index.
[2] Between 2013 and 2017, wages for the worker at the 10th percentile grew 5.5 percent, by 12.1 percent for the worker at the 20th percentile, 7.6 percent at the 30th, 3.9 percent at the 40th, 5.8 percent at the 50th, 5.7 percent at the 60th, 5.3 percent at the 70th, 7.5 percent at the 80th, and 9.3 percent at the 90th.
[3] The unemployment rate in Oregon was 5.7 percent in 2015, in 2016 was 4.9 percent, and in 2017 was 4.1 percent, the latter being the lowest on record at least since 1979. Bureau of Labor Statistics. Second Quarter 2017: Wage Gains Reflect Tighter Labor Market and Higher Minimum Wage, January 2018.
[4] Oregon began increasing its minimum wage above annual cost-of-living increases in 2016 in a multi-year pattern with three levels according to geographical area of the state. Ibid. Also, the Oregon Employment Department mentions that wage gains of the bottom 20 percent are likely attributable to recent increases in Oregon’s minimum wage, Wage Inequality in Oregon: The Widening Gap, July 24, 2018. Lastly, Elise Gould shows that wage growth among the lowest decile was strongest in 2017, and between 2013 and 2017, in states with a minimum wage increase in those time periods. The State of American Wages, Economic Policy Institute, Figures G and H, March 1, 2018.
[5] Meaningful wage growth since 1979 in Oregon has been limited to workers at the highest levels. For instance, in addition to gains of over 30 percent for the worker at the 90th percentile, the worker at the 80th percentile saw wages increase by 16.1 percent over the period. By contrast, the worker at the 70th percentile saw wages increase by 4.8 percent since 1979, and the worker at the 60th percentile saw wages fall by 3 percent.
[6] Highest Earning Oregonians Pull Away, OCPP, October 4, 2017.
[7] In 1979, the median wage for women was 41 percent below that of men. By 2006, the wage gap was 13.4 percent. It subsequently rose as high as 21.8 percent in 2010, shrinking in an uneven yearly pattern since.
[8] The available data begins in 1983. The median union wage in Oregon was 30 percent or more above the non-union median wage every year from 1983 to 1999, and in 2002, 2004, 2006, 2007, 2008, 2010, 2011, 2012, 2013, 2014, 2015, and 2016.